

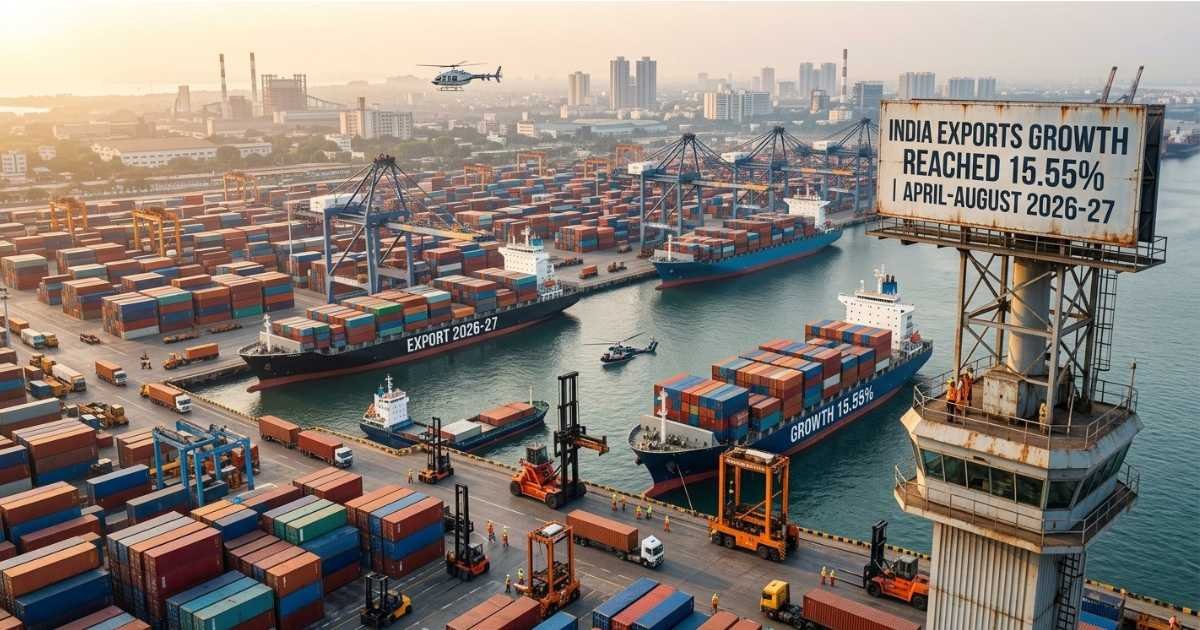
New Delhi: India’s export surge reached 15.55% during April-August 2026-27, with total exports estimated at US$399.27 billion. The figure covered merchandise and services exports and rose from US$345.55 billion a year earlier.
Total imports during the period reached an estimated US$459.65 billion. Imports stood at US$389.49 billion during April-August 2025-26, marking 18.01% growth.
As a result, the combined trade deficit widened to US$60.38 billion from US$43.94 billion. Merchandise exports also showed strong growth, rising 17.85% to US$215.91 billion.
Merchandise exports had stood at US$183.21 billion during the corresponding period. Meanwhile, merchandise imports rose to US$363 billion from US$307.09 billion.
The merchandise trade deficit therefore increased to US$147.09 billion. It was US$123.88 billion during April-August 2025-26.
Non-petroleum exports also recorded growth during the five-month period. They reached US$180.61 billion, up 14.39% from US$157.89 billion.
Services exports contributed further to the overall increase. Their estimated value rose to US$183.36 billion from US$162.34 billion.
Services exports were estimated to grow 12.95% during April-August 2026-27. At the same time, services imports increased to US$96.65 billion from US$82.40 billion.
The services trade surplus reached US$86.71 billion during the period. It had stood at US$79.94 billion in April-August 2025-26.
In August alone, total exports were estimated at US$82.68 billion. This represented a 25.41% rise over US$65.93 billion recorded in August 2025.
Total imports during August reached an estimated US$92.09 billion. They increased 18.75% from US$77.55 billion a year earlier.
The overall trade deficit improved in August. It narrowed to US$9.41 billion from US$11.62 billion in August 2025.
Merchandise exports in August reached US$43.81 billion. They had stood at US$34.74 billion in the same month last year.
India export surge driven by electronics and petroleum
Several major product groups supported the India export surge in August. Electronic goods recorded an 89.82% increase, with exports rising to US$5.55 billion from US$2.93 billion.
Petroleum products exports climbed 63.27% to US$6.81 billion. They had reached US$4.17 billion in August 2025.
Engineering goods exports also recorded strong growth. Their value rose 24.86% to US$12.32 billion from US$9.87 billion.
Organic and inorganic chemicals exports increased 16.38%. The value rose to US$2.80 billion from US$2.41 billion.
Cotton yarn, fabrics, made-ups and handloom products also gained 13.79%. Exports increased to US$1.12 billion from US$0.99 billion.
Iron ore exports recorded the highest growth among the listed product categories. They increased 126.3% during August 2026.
Meat, dairy and poultry products rose 37.08%. Handicrafts excluding handmade carpets increased 29.63%, while marine products grew 27.76%.
Plastic and linoleum exports increased 18.92%. Coffee rose 17.08%, while man-made yarn, fabrics and made-ups grew 9.92%.
Cereal preparations and miscellaneous processed items recorded 7.39% growth. Carpet exports increased 5.38%, while rice exports rose 4.12%.
Drugs and pharmaceuticals exports grew 3.84%. Cashew increased 3.59%, while gems and jewellery exports rose 0.69%.
Some import categories, however, recorded declines during August. Gold imports fell 57.75%, while pulp and waste paper imports declined 13.83%.
Iron and steel imports dropped 11.69%. Newsprint imports decreased 10.85%, while textile yarn, fabric and made-up articles fell 8.12%.
Medical and pharmaceutical product imports declined 7.9%. Wood and wood products fell 3.17%, while leather and leather products decreased 1.33%.
Organic and inorganic chemical imports also recorded a marginal decline of 0.51%.
Non-petroleum exports reached US$37 billion in August. They had stood at US$30.57 billion during August 2025.
Non-petroleum imports rose to US$53.98 billion from US$48.69 billion. Meanwhile, non-petroleum and non-gems and jewellery exports reached US$34.68 billion.
The corresponding figure was US$28.26 billion in August 2025. Imports in the same category rose to US$49.22 billion from US$41.39 billion.
For April-August 2026-27, non-petroleum and non-gems and jewellery exports reached US$168.69 billion. They had stood at US$146.52 billion a year earlier.
Imports in this category increased to US$241.24 billion from US$202.34 billion. The gems and jewellery category included gold, silver, pearls and precious and semi-precious stones.
Export destinations also recorded notable gains during August. The United States posted 21.83% growth, while Singapore recorded 160.96% growth.
Spain recorded 196.47% growth in export value. Exports to China increased 52.35%, while Tanzania recorded 214.52% growth.
During April-August 2026-27, Singapore recorded 96.56% growth in export value. China increased 38.71%, while the United States recorded 6.17% growth.
Tanzania posted 129% growth during the five-month period. Malaysia also recorded a 75.4% increase.
Import sources showed strong increases as well. Imports from the United States rose 65.78% in August, while Russia recorded 43.82% growth.
Imports from China increased 17.07%. Oman recorded 157.45% growth, while Taiwan posted 108.31%.
During April-August 2026-27, imports from Russia rose 56.69%. China increased 27.01%, while the United States recorded 29.6% growth.
Imports from Oman surged 190.63%. Brazil also recorded strong growth of 159.83% during the period.
The services figures for August remained estimates. The latest services data released by the Reserve Bank of India covered July 2026.
The data for April-August 2025-26 and April-June 2026-27 was revised on a pro-rata basis. The revisions used quarterly balance of payments data.
Overall, merchandise and services exports recorded strong growth during the first five months. However, imports increased at a faster rate, widening the combined trade deficit.
